Top page

In the left column, links to 1) Information about this site, 2) Similarity search form, 3) Keyword search form, 4) KAOS and KDRI Home page are provided.
Image of five chromosomes shown in the right side is a client-side clickable map. Netscape Navigator 2 or above is needed to use the map. 1) If a certain chromosome number is clicked, a list of all the sequence-finished clones on the requested chromosome is shown. 2) If a region between genetic markers placed on the chromosome images shown in green bars is clicked, sequenced clones within the region are listed.
Similarity search form
TBLASTN, BLASTN similarity searches by BLAST 1.4.9 are provided. The library is constituted with genomic sequences deposited in GenBank by AGI. The library is updated weekly at Sunday noon, JST (Japan Standard Time).
In the output of a search result, identifier is placed on the top of alignments, which is linked to the graphic display of the clone. If the corresponding clone is not ready in KAOS, it is linked to outside databases.
[Hint] There are two possible reasons for the time-outs of BLAST searches. 1) The network or the Kazusa web server is busy. In this case, the user should wait a little while and try again. 2) The query sequence contained non-specific sequence patterns which would produce a large amount of HSPs. In this case, the search would not be completed even tried again.
Keyword search form
A keyword search for clone names and a full-text keyword search for similarity search output are provided in KAOS.
[Hint] Searches with regular expressions are not accepted for clonename search. For example, when searching for a clone including "F10", input "F10" not "^F10".
Clone list
[sample: Chromosome 1: North end - ATTS0477]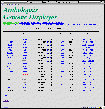
Clones on each area of chromosomes are listed on the table in alphabetical order. Graphics displaying orders of clones are under construction and will be released soon.
- Clone
A status "Ready" clone is linked to its graphic display. - Status
When a clone is "Ready", its re-computation at Kazusa is completed and is linked to the graphic display. The "Processing" clones are expected to be ready within two weeks. Processing of "Waiting" clones have not been started yet. This status is temporally made. Within a few months there will be only "Ready" and "Processing" clones after processing of all the clones are started. - Accession
Accession numbers are presented. [G] or [D] following the numbers is linked to its GenBank or DDBJ entries, respectively. They are shown in a different window. - Team
Linked to the Arabidopsis genome project homepage of the team which the clone was sequenced. - Date
Shows the date of GenBank release or the latest update of the clone. - DB's
Links to external databases. 1) Information page of the clone presented in AtDB's web site and 2) Information page of the clone in the web site of the team which nucleated the clone.
Graphics along a clone
[sample: F12F1]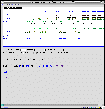
When the clone name of a status ready clone is clicked, its whole image is shown in a different window. On the image, GenBank CDS's, BLASTN/BLASTX alignment clusters and GENSCAN gene models are clickable at the default setting, "cluster" (see below).
Settings of graphic display options- Offset
Enables to offset the picture. The default is 0, and the image starts from the first base registered in GenBank. If 10000 is inputted, the image starts at 10 Kb from the left end. - Window
Nucleotide length to be shown graphically. If 15000 is selected, 15000 bases from the offset point is shown graphically. At the default setting, the length of each clone is previously selected, which is the largest number for the clone.When smaller window size is selected, one triangle and two-triangles-in-a-row appear on both ends of the picture. 1) One triangle scrolls half the screen to either direction. 2) Two-triangles-in-a-row scrolls the entire screen to either direction.
- Scale
Set the scale of the image by selecting how many bases to be shown per one pixel. At the default setting, it is automatically selected according to the length of the clone. For example, 100 Kb clone is shown in 150 base / 1 pixel. - Link Type
Select "cluster" or "exon". At the default setting, "cluster", GenBank CDS's, BLASTN/BLASTX alignment clusters and GENSCAN gene models are clickable, but Grail exons and GENSCAN suboptimal exons are not. In the case of displaying a large area, "cluster" gives faster response since less amount of HTML data are forwarded during the page loading.When "exon" is selected and REDRAW button pushed, GENSCAN gene models, GenBank CDS's and all the individual exon candidates become clickable.
- Show I/E boundary candidates
When it is checked and REDRAW button pushed, intron-exon boundary candidates predicted by NetGene2 and SplicePredictor are shown. Each I/E boundary candidate is shown by a graphic item which looks like a thumbtack. A vertical bar represents an exon side and horizontal bar is an intron side of a boundary. It is recommended to execute in a close-up state by taking the denominator scale small. Otherwise, I/E boundary candidates will be shown too densely. - position
When position is checked and REDRAW button pushed, ends of exons and I/E boundary candidates of the exon side are shown. To prevent too many plots, Scale denominator over 25 is not accepted in the position display option. For the same reason, only Scale denominator below 2 is shown for the positions predicted by SplicePredictor.Exon boundaries by GenBank CDS, Grail, and GENSCAN are differently colored according to phases. phase 0 (intron/exon boundary is at the end of the codon) is blue, phase 1 (intron/exon boundary is at the first letter of the codon) is red, phase 2 (intron/exon boundary is at the second letter of the codon) is yellow. When performing gene-modeling manually, frameshifts are prevented by connecting exons with a donor and an acceptor of the same color.
[Hint] Horizontal pixels of a image is obtained by dividing the number in Window by the denominator of Scale. Additional 250 pixel is necessary for margins located at right and left ends. If you have a large display coverable of 1200 pixel, Window 10000, Scale 1/15, position checked and REDRAWed image is optimal for the comprehension of a few gene structures. For displays with 800 pixel width, Window 5000 and Scale 1/10 is recommended.
List of a cluster
[sample: F12F1 BLASTX alignment cluster 1 | F12F1 GENSCAN gene model 1 | F12F1.1 (GenBank annotation)]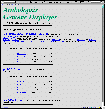
When "cluster" is selected for Link Type, clickable images are linked here. Displayed here are the collection of same directional BLAST local alignments, GenBank CDS (protein gene) and gene model by GENSCAN, which means, clustered exons within the same gene are listed.
If a region had too many BLAST local alignments, they are sorted by the score and the highest five are listed. Only gene identifier is listed for the rest of the clusters, which becomes visible when "show all hits" link is clicked.
If a cluster is resulted other than from BLASTN, each position of exon or local alignment on the list is linked to the information page of the corresponding area (see below).
Information on an ORF
[sample: information on F12F1 8982..8800]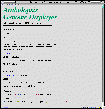
When "exon" is selected for Link Type, clickable graphic items are linked here. This is the page opens when exon positions in "cluster" page are clicked.
This is the most detailed level of information provided in KAOS. It is composed of one (or two or three) ORF(s). Exons predicted by GenBank annotation, Grail and GENSCAN within the same region are listed. Their positions are linked to the "cluster" page (see above).
Links for a single exon like Grail exon and GENSCAN suboptimal exon are only mentioned. Intron/exon boundary candidates and their phases on the frame are also shown. Phases are colored in the same way as graphics are, that is, phase 0 (intron/exon boundary is at the end of the codon) is blue, phase 1 (intron/exon boundary is at the first letter of the codon) is red, phase 2 (intron/exon boundary is at the second letter of the codon) is yellow.
