Asamizu E, Miura K, Kucho K, Inoue Y, Fukuzawa H, Ohyama K, Nakamura Y, Tabata S
Generation of Expressed Sequence Tags from low-CO2 and high-CO2 adapted cells of Chlamydomonas reinhardtii
DNA Research, 7, 305-307 (2000)
Figures and Tables
| Table 1 | Number of 5'-end ESTs generated from cDNA libraries of cells grown in low-CO2 and high-CO2 conditions |
| Low-CO2 | High-CO2 | Standard | |
|---|---|---|---|
| Number of ESTs Size-selected library |
7113 5856 |
7694 5756 |
7310 4261 |
| Total | 12969 | 13450 | 11571 |
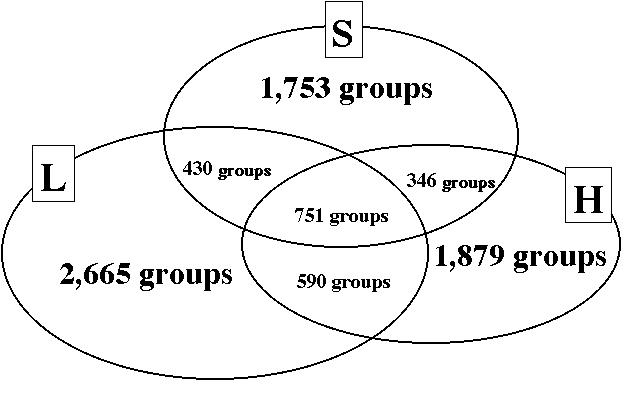
| Number of non-redundant groupsa | 4436 | 3566 | 3433 |
| Number of specific groupsb | 2665 | 1879 | 1753 |
| Number of common groupsc | 2117 |
a) Number of groups occurred in each of the low-CO2, high-CO2 and standard conditions
b) Number of groups occurred only in the low-CO2, high-CO2 or standard conditions
c) Number of groups commonly occurred in two or three conditions among the low-CO2, high-CO2 and standard conditions
| Table 2 | Classification of 5'-end ESTs appeared in common or only in low-CO2 or high-CO2 EST populations by similarity search against the non-redundant protein database. |
| Low-CO2 | High-CO2 | Common | ||||
|---|---|---|---|---|---|---|
| Similarity | Number of clones | Number of non-redundant ESTs | Number of clones | Number of non-redundant ESTs | Number of clones | Number of non-redundant ESTs |
| Genes of known functiona) | 648 | 384 | 363 | 269 | 14846 | 726 |
| Hypothetical genesb) | 139 | 91 | 64 | 50 | 831 | 105 |
| No similarityc) | 2647 | 2190 | 1740 | 1560 | 5141 | 1286 |
| Total | 3434 | 2665 | 2167 | 1879 | 20818 | 2117 |
a) Genes showed similarity to genes of known function,
b) Genes showed similarity to hypothetical genes that have no definition of function,
c) Genes showed no similarity
| Table 3 Classification of the non-redundant EST groups appeared in common or only in low-CO2 or high-CO2 EST populations with similarity to known protein genes by their functional categories. |
| Functional categories | Number of non-redundant groups | ||
|---|---|---|---|
| Common | Low-CO2 | High-CO2 | |
| Energy metabolism | 142 | 43 | 39 |
| Protein synthesis | 126 | 34 | 31 |
| Transport and binding proteins | 52 | 22 | 9 |
| Regulatory functions | 51 | 28 | 17 |
| Protein fate | 46 | 28 | 23 |
| Cellular processes | 43 | 18 | 10 |
| Amino-acid biosynthesis | 32 | 17 | 8 |
| General transcription | 25 | 15 | 15 |
| Fatty acid and phospholipid metabolism | 24 | 5 | 3 |
| Cellular structure, organization and biogenesis | 22 | 36 | 22 |
| Central intermediary metabolism | 20 | 12 | 9 |
| Biosynthesis of cofactors, prosthetic groups, and carriers | 18 | 7 | 5 |
| Signal transduction | 18 | 23 | 13 |
| Purines, pyrimidines, nucleosides, and nucleotides | 11 | 8 | 7 |
| Growth and development | 6 | 10 | 2 |
| DNA metabolism | 5 | 8 | 4 |
| Environmental response | 4 | 3 | 1 |
| Pathogen responses | 2 | 2 | 0 |
| Secondary metabolism | 1 | 4 | 3 |
| Other categories | 26 | 7 | 12 |
| Unclassified | 52 | 54 | 36 |
| Total | 726 | 384 | 269 |
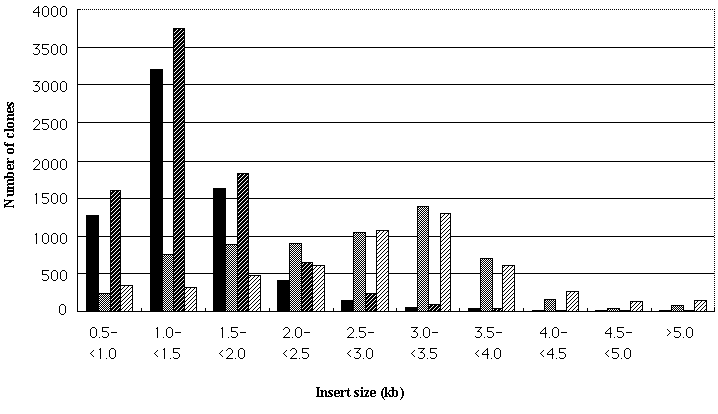
| Figure 1 | Size distribution of the inserts in analyzed cDNA clones from the normalized ( solid bars) and size-selected (gray bars) libraries of low-CO2 treated cells and normalized (solid bars with oblique lines) and size-selected (gray bars with oblique lines) libraries of high-CO2 treated cells. |
| Figure 2 | The relationship among the non-redundant EST groups generated from cells from standard(S), low-CO2 (L) and high-CO2(H) growth conditions. |
Chlamydomonas reinhardtii
Department of Plant Gene Research